T1#market
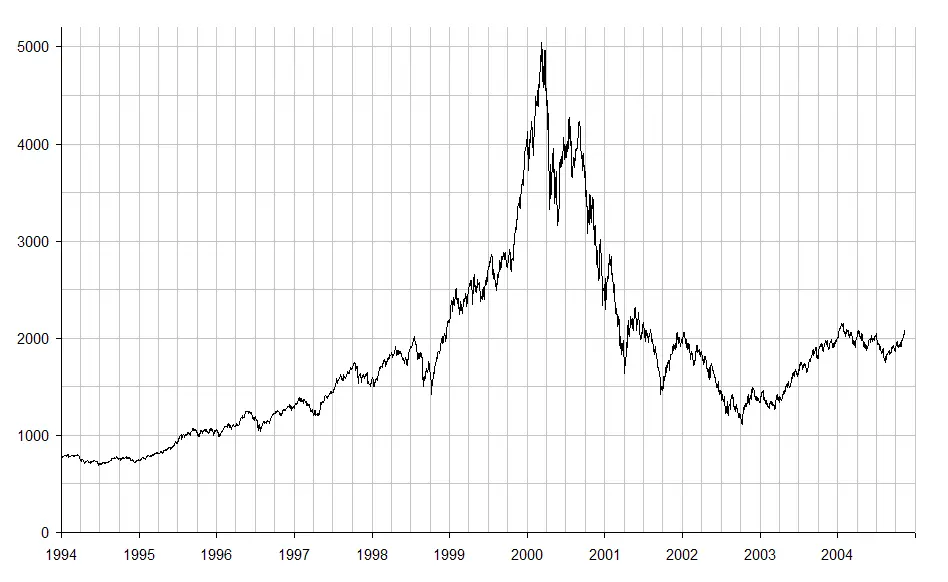
The Dot-Com Bubble Peaks and Bursts — NASDAQ 5,048.62
Metadata
- Date
- Decade
- 2000s
- Tier
- T1
- Sources
- 07
- Connections
- 01
- Tags
- #market
The dot-com bubble (called the IT bubble in Japan) was the late-1990s run-up in the share prices of internet companies far beyond what their businesses supported, followed by a collapse from spring 2000. The NASDAQ Composite, home to most of the young US tech listings, peaked with a closing high of 5,048.62 on 10 March 2000. Two years and seven months later, on 9 October 2002, it closed at 1,114.11, about 78% below the peak. It did not close above that level again until 23 April 2015.
The rise and fall in numbers
Daily NASDAQ Composite closes as published by the Federal Reserve Bank of St. Louis (FRED):
| Date | Close | Note |
|---|---|---|
| 17 July 1995 | 1,005.89 | Above 1,000 |
| 17 July 1998 | 2,008.76 | Roughly doubled in three years |
| 31 December 1999 | 4,069.31 | Last close of 1999 |
| 10 March 2000 | 5,048.62 | The peak |
| 14 April 2000 | 3,321.29 | Down about 34% in five weeks |
| 29 December 2000 | 2,470.52 | Last close of 2000 |
| 9 October 2002 | 1,114.11 | The trough, about 78% below the peak |
| 23 April 2015 | 5,056.06 | First close above the 2000 peak |
The index first closed above 5,000 on 9 March 2000 (5,046.86) and peaked the next day. From the end of 1999 to the peak it rose about 24% in ten weeks; within five weeks of the peak it had lost a third.
"Irrational exuberance"
The question was raised in public more than three years before the top. On 5 December 1996 the Federal Reserve chairman, Alan Greenspan, asked in a speech how central bankers would know when "irrational exuberance" had unduly escalated asset values, which could then suffer unexpected and prolonged contractions — as they had, he noted, in Japan over the previous decade.
The NASDAQ closed at 1,300.12 that day. It would go on to nearly quadruple. The starting gun most often cited is Netscape's initial public offering in August 1995, which that page covers.
Pets.com: nine months as a public company
The company most often named as the emblem of the bust is Pets.com, an online pet-supplies retailer. Its filings with the US Securities and Exchange Commission trace the whole arc.
| Date | Event (from SEC filings) |
|---|---|
| February 1999 | Company formed |
| 10 February 2000 | Date of the prospectus: 7.5 million shares at $11, $82.5 million in total, Nasdaq symbol IPET |
| 4 November 2000 | The board decides to wind down unless a viable offer arrives by 9 a.m. on 7 November |
| 7 November 2000 | No offer; the company announces an orderly wind-down and the layoff of about 255 of its 320 employees |
The prospectus listed the company's dependence on an advertising agreement with Amazon.com as a risk factor. The wind-down press release said Merrill Lynch had contacted more than 50 domestic and international prospects on its behalf, and that fewer than eight were even prepared to visit. The company said it had nearly 570,000 customers. Its chief executive, Julie Wainwright, said in the release that it was well known to be a very difficult environment for business-to-consumer internet companies.
From share prices to the real economy
The National Bureau of Economic Research dates the US business-cycle peak to March 2001 and the trough to November 2001: the recession began a year after the market top.
The damage was not confined to online retail. Japan's 2003 White Paper on Information and Communications attributed the late-1990s growth of the US telecoms and IT industry to an expanding economy and internet-driven demand, plentiful money from venture capital and individual investors, and easier market entry after the Telecommunications Act of 1996. It attributed the collapse to saturated demand, heavy investment and acquisition debt built on over-optimistic traffic forecasts, and over-competition among new entrants.
The result was a run of telecom bankruptcies. Global Crossing filed for Chapter 11 in January 2002 and WorldCom in July 2002; the white paper put WorldCom's filing, with $21.3 billion in revenue, $107 billion in assets and $41 billion in liabilities, as the largest in US history. In Europe, telecom shares also peaked in March 2000 and fell 83% over two and a half years, while the high prices paid in third-generation mobile spectrum auctions weighed on the major carriers.
For the labour-market side, the page on the 2023 tech layoffs uses the dot-com bust as its yardstick: the annual record for tech-sector job cuts announced, 168,395, was set in 2001.
Japan's "IT bubble"
Internet shares were bid up and then fell in Japan in the same period. Japan's 2001 White Paper on Information and Communications noted that US dot-com share prices had dropped to roughly a quarter within a year of their peak around March 2000, and that as venture capitalists began to insist on profits, loss-making companies were being pushed into restructuring and bankruptcy. In Japan, it said, the e-commerce market was still growing but concentrating, and apart from a few well-known sites the fight for survival was intensifying.
According to the 2003 white paper, Japan's information and communications industry grew from ¥79 trillion in 1995 to ¥123 trillion in 2001, but company results deteriorated from 2000 to 2001 as demand for PCs and mobile phones levelled off and the US and European slump spread. Equipment makers that depended heavily on the US were hit hardest.
What was left
Share prices collapsed; the internet did not. The 2003 white paper reported that demand for equipment and services in Japan had partly recovered in 2002 on the back of surging broadband and new products such as camera phones. In the US, several of the failed new carriers — Teligent, Williams Communications and XO Communications — emerged from Chapter 11 between September 2002 and January 2003.
The wider story of the web is on the internet and web timeline, and the rest of that year on the overview timeline. Ten weeks before the peak, the world had passed the Y2K rollover.
Questions this page answers
- When did the dot-com bubble peak?
- On 10 March 2000, measured by NASDAQ Composite closes: 5,048.62. The index had first closed above 5,000 the day before. It then fell about 78%, to 1,114.11 on 9 October 2002.
- When did the NASDAQ recover its 2000 peak?
- It first closed above 5,048.62 on 23 April 2015, at 5,056.06, more than 15 years after the peak.
- What happened to Pets.com?
- According to its SEC filings, it sold 7.5 million shares at $11 in February 2000 and on 7 November 2000 announced an orderly wind-down and the layoff of about 255 of its 320 employees, nine months after going public.
- What about Japan's IT bubble?
- According to Japan's information and communications white paper, the industry grew from ¥79 trillion in 1995 to ¥123 trillion in 2001, but company results deteriorated in 2000 and 2001 as PC and mobile-phone demand levelled off and the US and European slump spread, hitting equipment makers that depended on the US hardest.
Sources
PrimaryNASDAQ Composite Index (NASDAQCOM), daily close — Federal Reserve Bank of St. Louis, FRED
Daily closes 1995–2015 (peak 5,048.62, trough 1,114.11, 5,056.06 on 23 April 2015)
PrimaryPets.com, Inc. Prospectus (Form 424B4), February 10, 2000 — U.S. Securities and Exchange Commission
7.5 million shares at $11 for $82.5 million, symbol IPET, formed February 1999, dependence on the Amazon.com advertising agreement
The wind-down, about 255 of 320 employees laid off, more than 50 prospects contacted, nearly 570,000 customers
Primary平成15年版 情報通信白書 IT バブルの崩壊と情報通信産業 — 総務省
Causes of the US boom and bust, the Global Crossing and WorldCom failures, the 83% fall in European telecom shares, and Japan's ¥79 to ¥123 trillion growth and deteriorating results
Last updated: